README
Netdata Open Dashboard (netdata-odash)
Netdata Open Dashboard is an open source dashboard for Netdata collector
It imposes no node limits and works by querying netdata API endpoints to gather host metrics
The dashboard shows all relevant system metrics and has help dialogue on each chart to explain what the metrics mean and how they correlate to overall system health
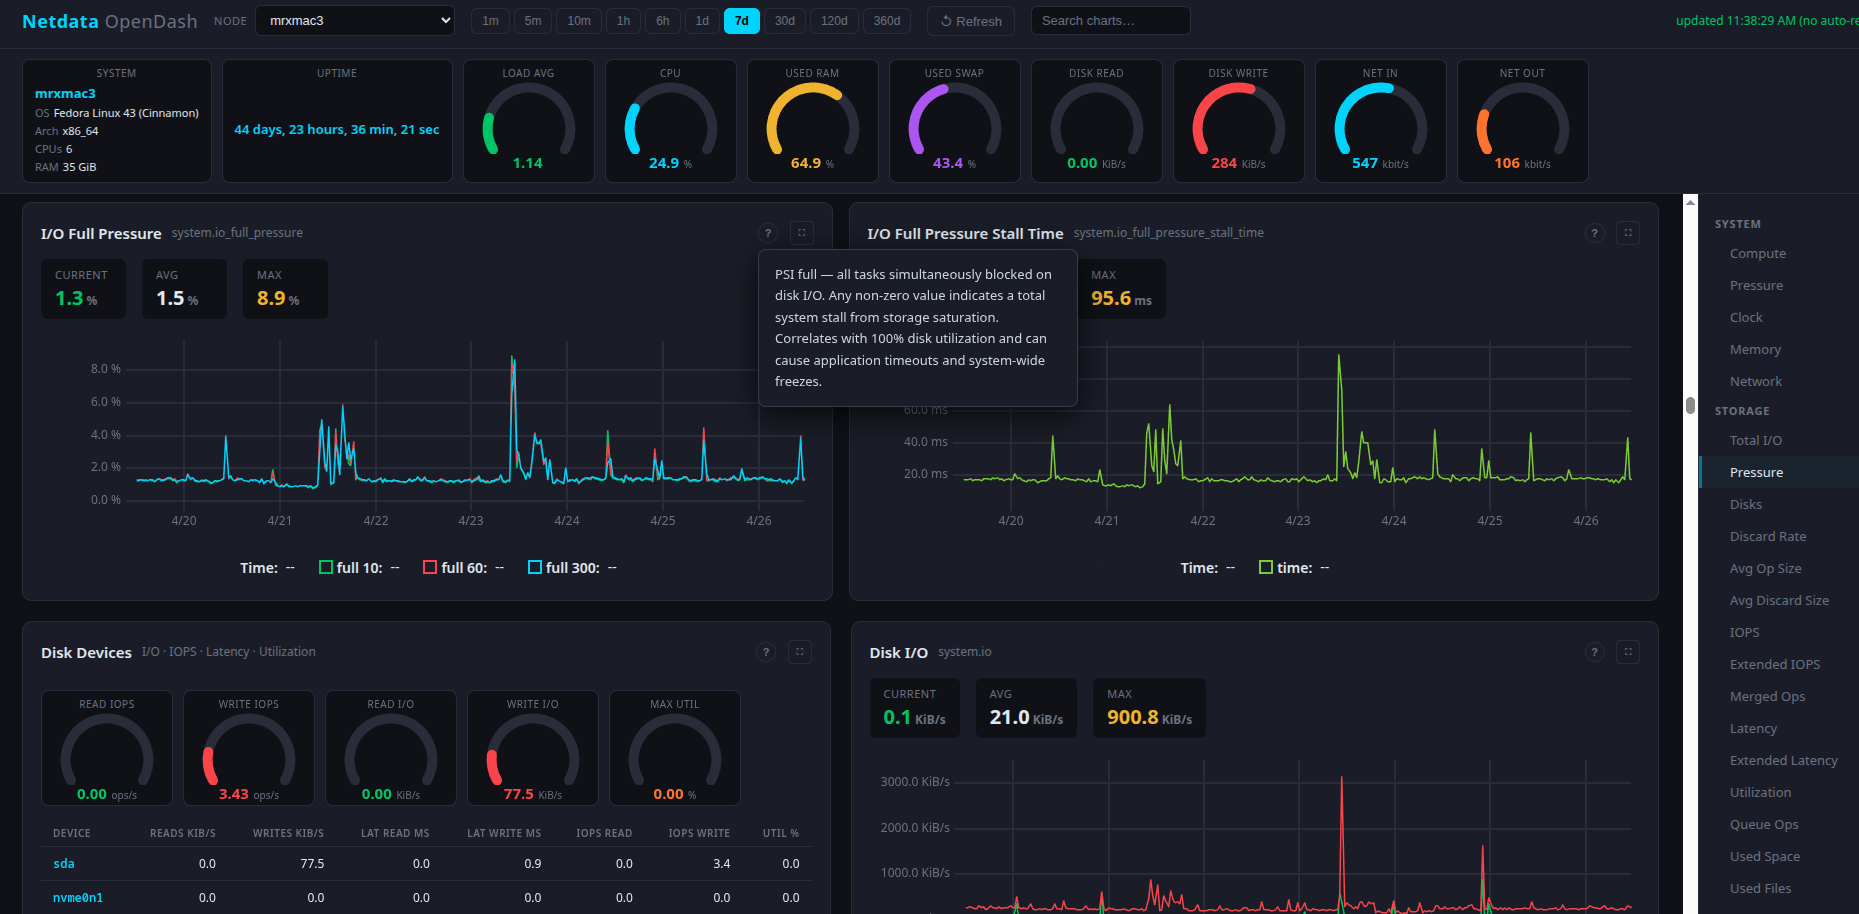
This dashboard has been tested on Fedora 43 linux and Rocky 9 linux only
Installation
For odash to work, you will need a host with netdata installed and has its stream disabled (acts as a collector)
odash will connect to this host via API and query metrics
Usage
start odash using the systemd script provided
Odash will query Netdata API backend and return a dashboard with metrics.
By default, it will run on localhost port 8080, and query localhost:19999
to change default ports, you can use .env file or export these ENV variables
NETDATA_PORT=19999

ODASH_PORT=8080
or pass the ports directly when running the binary
./netdata-odash --netdata-port 19999 --odash-port 8080if ports are passed directly via cli arguments, they will override the environment variables
to see the netdata-odash version, run
./netdata-odash --helpBuild from source
odash requires Crystal language and PCRE devel package
dnf install pcre-devel

crystal build src/netdata-odash.cr -o bin/netdata-odash
Roadmap
- add dynamic assistant section - for last 5 min timeframe - check all chart metrics and show warning signs, ie load avg 1min is high, disk IO is high, show warning in this section that load avg + disk io are high and suggest cause for this
Development
You can contribute to this project by forking this repo and submitting a PR
Contributing
- Fork it (https://github.com/perfecto25/netdata-odash/fork)
- Create your feature branch (
git checkout -b my-new-feature) - Commit your changes (
git commit -am 'Add some feature') - Push to the branch (
git push origin my-new-feature) - Create a new Pull Request
Contributors
- mreider - creator and maintainer