ishi
Version, currently 0.3.012 versions
- 0.7.5latestJul 10, 2021
- 0.7.4not indexedJul 10, 2021
- 0.7.3not indexedJul 10, 2021
- 0.7.2not indexedJul 10, 2021
- 0.7.1not indexedJul 10, 2021
- 0.7.0not indexedJul 10, 2021
- 0.6.0not indexedJul 10, 2021
- 0.5.0not indexedJul 10, 2021
- 0.4.0not indexedJul 10, 2021
- 0.3.0not indexedJul 10, 2021
- 0.2.0not indexedJul 10, 2021
- 0.1.0not indexedJul 10, 2021
github.com/toddsundsted/ishi
Graph plotting package with a small API and sensible defaults powered by gnuplot.
47 stars
0 dependents
License: Apache License, Version 2.0
Nothing has been indexed for 0.3.0 yet. The tag is recorded, its shard.yml has not been read, so the manifest and dependency list below are empty because they are unknown rather than because they are absent.
Installation
# Add this to your shard.yml
dependencies:
  ishi:
    github: toddsundsted/ishi
    version: ~> 0.3.0
Then run:
shards installshard.yml
No shard.yml has been indexed for 0.3.0. You can read it on the repository.
Dependencies
Unknown: the shard.yml for this version has not been read yet.
README
This README is the one indexed from the repository at its latest ref, not from the tag for this version.
# 石の上にも三年
[](https://github.com/toddsundsted/ishi/releases)
[](https://travis-ci.org/toddsundsted/ishi)
[](https://toddsundsted.github.io/ishi/)
Graph plotting package with a small API and sensible defaults powered by gnuplot.
Requires [gnuplot](http://www.gnuplot.info/).
## Installation
1. Add the dependency to your `shard.yml`:
```yaml
dependencies:
ishi:
github: toddsundsted/ishi
```
2. Run `shards install`
## Usage
To display a line chart of the data points in `xdata` (the x values)
and `ydata` (the corresponding y values):
```crystal
require "ishi"
ishi = Ishi.new
ishi.plot(xdata, ydata)
ishi.show
```
Or, if you prefer command-style syntax:
```crystal
require "ishi"
Ishi.new do
plot(xdata, ydata)
end
```
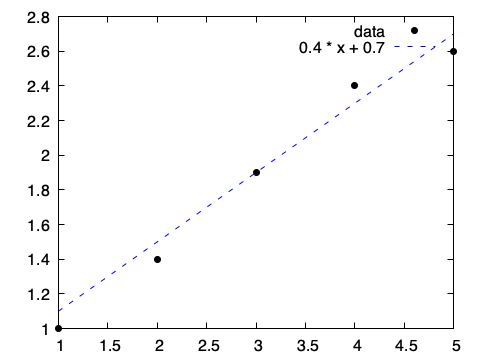
A chart can display multiple plots. The following code displays two
plots in one chart: one derived from discrete data points and the
other from the equation of a line.
```crystal
require "ishi"
Ishi.new do
plot([1, 2, 3, 4, 5], [1.0, 1.4, 1.9, 2.4, 2.6], "ko", title: "data")
plot("0.4 * x + 0.7", "b--")
end
```
The [etc/examples](https://github.com/toddsundsted/ishi/tree/master/etc/examples) directory contains examples of usage.
### plot
`plot` plots points and lines. It takes data in several formats:
* `plot(ydata)` - y values in *ydata* with x values ranging from `0` to `ydata.size - 1`
* `plot(xdata, ydata)` - x values in *xdata* and corresponding y values in *ydata*
* `plot(xdata, ydata, zdata)` - x values in *xdata*, y values in *ydata*, and z values in *zdata*
* `plot(expression)` - any gnuplot-supported mathematical expression
*xdata*, *ydata* and *zdata* may be any type that implements
`Indexable(Number)`. Chart dimensionality (2D or 3D) is inferred from
the data.
All `plot` methods/commands accept the optional named arguments
*title*, *style*, *dashtype* (*dt*), *linecolor* (*lc*), *linewidth*
(*lw*), *pointsize* (*ps*), *pointtype* (*pt*), *linestyle* (*ls*),
*fillstyle* (*fs*) and *format*.
*title* specifies the title of the plot in the chart key.
*style* explicitly specifies the style of the plot (`:lines`,
`:points`, etc.). Ishi will try to infer the style from the data and
the other named arguments (for example, if both *linewidth* and
*pointsize* are provided, the style will be `:linespoints`).
By default, plots are rendered with solid lines. *dashtype* (*dt*)
specifies the pattern of dashes to use instead. *dashtype* may be an
array of pairs of numbers that specify the length of a solid line
followed by the length of an empty space (e.g. `[2, 3, 5, 7]`), or it
may be a string composed of . (dot), - (hyphen), \_ (underscore) and
(space), which is then converted into an array as follows: each "."
becomes `[2, 5]`, "-" becomes `[10, 10]`, "\_" becomes `[20, 10]` and
" " adds 10 to the previous empty value.
*linecolor* specifies the color to use for lines and points. Colors
may be specified by name (e.g. "red", "blue", or "green") or by
hexadecimal color value (e.g. "#AARRGGBB" or "#RRGGBB").
*linewidth* and *pointsize* scale the width of lines and the size of
points, respectively. A value of 2.0 is twice as big as the default
width or size.
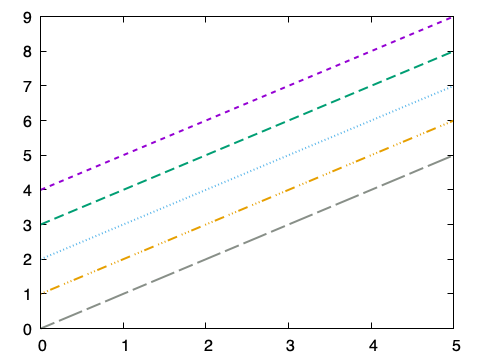
The following code demonstrates the use of *dashtype*, *linecolor* and
*linewidth*:
```crystal
require "ishi"
Ishi.new do
plot("x + 4.0", dashtype: "-", linewidth: 2)
plot("x + 3.0", dashtype: "_", linewidth: 2)
plot("x + 2.0", dashtype: ".", linewidth: 2)
plot("x + 1.0", dashtype: "..._", linewidth: 2)
plot("x + 0.0", dashtype: [30, 10, 50, 10], linewidth: 2, linecolor: "#88001100")
end
```
*pointtype* selects the type of point to render. Available types
depend on the gnuplot terminal device used, but commonly supported
values are . (dot), + (plus sign), x (multiplication sign), *
(asterisk), s (square), o (circle), ^ (up triangle), and v (down
triangle) and d (diamond).
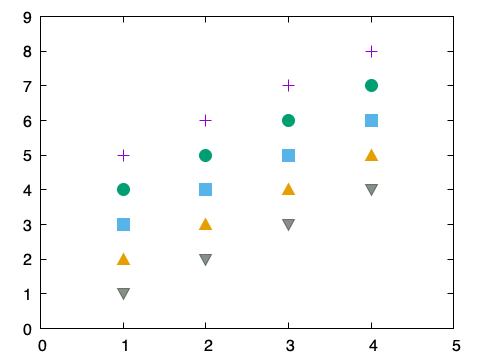
The following code demonstrates the use of *pointtype* and
*pointsize*:
```crystal
require "ishi"
Ishi.new do
plot([1, 2, 3, 4], [5, 6, 7, 8], pointtype: 1, pointsize: 2)
plot([1, 2, 3, 4], [4, 5, 6, 7], pointtype: "o", pointsize: 2)
plot([1, 2, 3, 4], [3, 4, 5, 6], pointtype: "s", pointsize: 2)
plot([1, 2, 3, 4], [2, 3, 4, 5], pointtype: "^", pointsize: 2)
plot([1, 2, 3, 4], [1, 2, 3, 4], pointtype: "v", pointsize: 2, linecolor: "#88001100")
end
```
The *format* argument is a short string used to specify color, point
and line, simultaneously.
Color is a letter from the set b (blue), g (green), r (red), c (cyan),
m (magenta), y (yellow), k (black) or w (white). Point is a letter
from the set . (dot), + (plus sign), x (multiplication sign), *
(asterisk), s (square), c (circle), ^ (up triangle), v (down triangle)
or d (diamond). Line may be - (solid line), -- (dashed line), !
(dash-dot line) and : (dotted line).
Given these rules, the format string "b" is a solid blue line, "or" is
red circles, "^k:" is black triangles connected by dotted black lines,
"g-" is a solid green line and "--" is a dashed line.
*format* may also be a single word color name or hexadecimal color
value, in which case point and line may not be specified.
Returning to the first example, the code uses *format* to customize
the plots:
```crystal
require "ishi"
Ishi.new do
plot([1, 2, 3, 4, 5], [1.0, 1.4, 1.9, 2.4, 2.6], "ko", title: "data")
plot("0.4 * x + 0.7", "b--")
end
```
The *format* "ko" could also be expressed explicitly (and much more
verbosely) with the named arguments `linecolor: "black", pointtype: 7`,
and the *format* "b--" with `linecolor: "blue", dashtype: 2`.
### scatter
`scatter` draws scatter plots. It takes data in several formats:
* `scatter(xdata, ydata)` - x values in *xdata* and corresponding y values in *ydata*
* `scatter(xdata, ydata, zdata)` - x values in *xdata*, y values in *ydata*, and z values in *zdata*
Chart dimensionality (2D or 3D) is inferred from the data. By default,
`scatter` places a . (dot) at each point.
All `scatter` methods/commands accept the optional named arguments
*title*, *style*, *dashtype* (*dt*), *linecolor* (*lc*), *linewidth*
(*lw*), *pointsize* (*ps*), *pointtype* (*pt*), *linestyle* (*ls*) and
*format*.
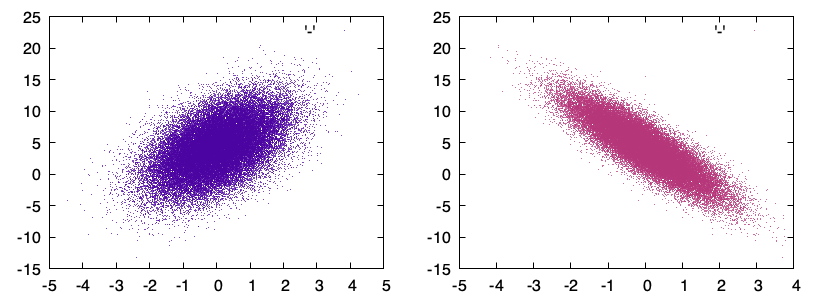
The following code demonstrates the use of *scatter*:
```crystal
require "ishi"
Ishi.new do
scatter(xdata, zdata, lc: "#4b03a1")
scatter(ydata, zdata, lc: "#b5367a")
end
```
### imshow
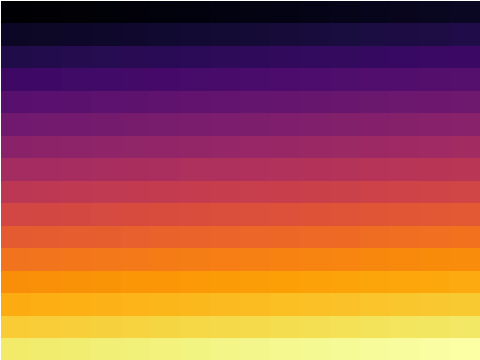
`imshow` displays data as a pseudocolor, heatmapped image:
* `imshow(data)` - *data* is two-dimensional scalar data, which will be rendered as an image
The following code demonstrates the use of *imshow*:
```crystal
require "ishi"
Ishi.new do
palette(:inferno)
imshow(data)
margin(0, 0, 0, 0)
show_colorbox(false)
show_border(false)
show_xtics(false)
show_ytics(false)
show_key(false)
end
```
### charts
`charts` changes the number of charts in the figure:
* `charts(rows, cols)` - *rows* and *cols* are the number of rows and columns in the figure
By default a figure has one chart. This call changes the number of
charts in the figure. The original chart is preserved and becomes the
chart in the first row, first column of the new layout.
When called without a block, `charts` returns the charts in the
figure.
```crystal
require "ishi"
figure = Ishi.new
charts = figure.charts(2, 2)
charts[0].plot([1, 2, 3, 4])
charts[1].plot([1, 1, 3, 2])
charts[2].plot([1, 1, 1, 1])
charts[3].plot([4, 3, 2, 1])
figure.show
```
When called with a block, `charts` Yields each chart as the default
receiver of the supplied block. Block arguments are *i* (the i-th
chart in the figure), *row* and *col* (the row and column of the
chart).
```crystal
require "ishi"
figure = Ishi.new
figure.charts(2, 2) do |i, row, col|
plot([1, 2, 3, 4].rotate(i), title: "#{row},#{col}")
end
figure.show
```
### Non-numeric labels on the x-axis
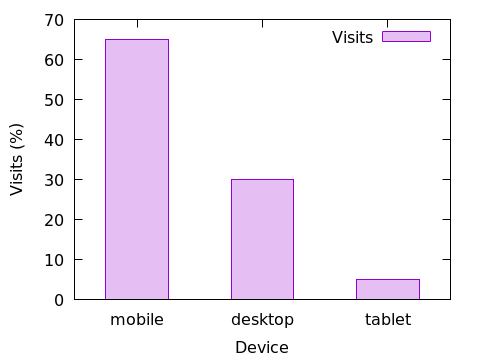
`xtics` sets non-numeric labels for positions on the x-axis.
The following code demonstrates the use of *xtics*:
```crystal
require "ishi"
Ishi.new do
x = [1, 2, 3]
y = [65, 30, 5]
plot(x, y, title: "Visits", style: :boxes, fs: 0.25)
.boxwidth(0.5)
.ylabel("Visits (%)")
.xlabel("Device")
.xtics({
1.0 => "mobile",
2.0 => "desktop",
3.0 => "tablet"
})
end
```
### MXNet::NDArray
`MXNet::NDArray` is an indexable, multi-dimensional array that
efficiently supports numerical operations (transposition, matrix
multiplication, etc.).
All appropriate methods/commands accept instances of `MXNet::NDArray`
with the correct shape (1-dimensional vectors for x-values, for
example).
```crystal
require "ishi"
require "mxnet"
m = MXNet::NDArray.array(
[[0, 0, 1, 1],
[1, 2, 3, 4],
[1, 1, 2, 2]]
)
figure = Ishi.new
charts = figure.charts(1, 2)
charts[0].plot(m[0], m[1], m[2])
charts[1].plot(m[.., 0], m[.., 1], m[.., 2])
figure.show
```
See [MXNet.cr](https://github.com/toddsundsted/mxnet.cr) for more
information on the complete library.
### Extensions
By default, Ishi pops open a window to display charts. However, Ishi
comes with extensions that render charts as text, HTML, PNG or inline
images in the terminal; or that write to other `IO` destinations.
Note: terminal image display only works with
[ITerm2](https://www.iterm2.com/).
To plot the *sin(x)* function as text:
```crystal
require "ishi/text" # or "ishi/html" or "ishi/iterm2"
Ishi.new do
plot("sin(x)")
end
```
This produces:
```
1 +--------------------------------------------------------------------+
| * * + * ** + * * |
0.8 |-+ * * * * sin(x* *******-|
| * * * * * * |
0.6 |-+ * * * * * * +-|
| * * * * * * |
0.4 |*+ * * * * * *+-|
|* * * * * * * |
0.2 |*+ * * * * * *+-|
| * * * * * * * |
0 |-* * * * * * *-|
| * * * * * * *|
-0.2 |-+* * * * * * +*|
| * * * * * * *|
-0.4 |-+* * * * * * +*|
| * * * * * * |
-0.6 |-+ * * * * * * +-|
| * * * * * * |
-0.8 |-+ * * * * * * +-|
| * * + ** * + * * |
-1 +--------------------------------------------------------------------+
-10 -5 0 5 10
```
You can pass in an `IO` instance. Chart data will be written to the
`IO` instance instead of `STDOUT`.
```crystal
require "ishi/text" # or "ishi/html" or "ishi/png"
io = IO::Memory.new
Ishi.new(io) do
plot("sin(x)")
end
```
## Contributors
- [Todd Sundsted](https://github.com/toddsundsted) - creator and maintainer
- [lbarasti](https://github.com/lbarasti) - contributor
Documentation
Built from the current release. The first visit to a release nobody has asked for starts its build.
Links
This release
- Version
0.3.0- Tagged
- Jul 10, 2021
- Commit
148cdf63de74- Indexed
- not yet
Dependents
No indexed shard depends on this one yet.
Repository
github.com/toddsundsted/ishi
Metadata
- Created
- Aug 12, 2026
- Updated
- Aug 12, 2026
- Synced
- Aug 12, 2026
- Versions
- 12